Mashup Your Data for the Masses


Back in the days when Google Maps was new (according to Wikipedia it is barely 5 years old), there was a movement to try to put custom data on top of the base map. In the early days there were no APIs for web developers or Google Maps based smartphone libraries. Instead people like Adrian Holovaty had to actually hack the javascript that powered the Google Maps front end to add their own data and embed the maps on their own webpages for early mashups such as the now-defunt Chicago Crime or Housing Maps.
These days, APIs, such as those mentioned above, make it very simple to create your own mashups with Google Maps tiles and your own data. For example, entering the link to a workspace that returns KML on a public facing FME Server into the Google Maps search box is all you need to do to show your data on Google Maps.
Mashups, of course, can get much more powerful than a simple KML file displayed on Google Maps. While GIS professionals may feel at home in powerful GIS tools or web interfaces, they are far too complex for the general public to use. Organizations are now beginning to understand this and are creating mashups that can be easily viewed in an environment that people are already familiar with – i.e. Google Maps or Bing Maps. One company at the forefront is Energy Australia.
Mashups for External Use
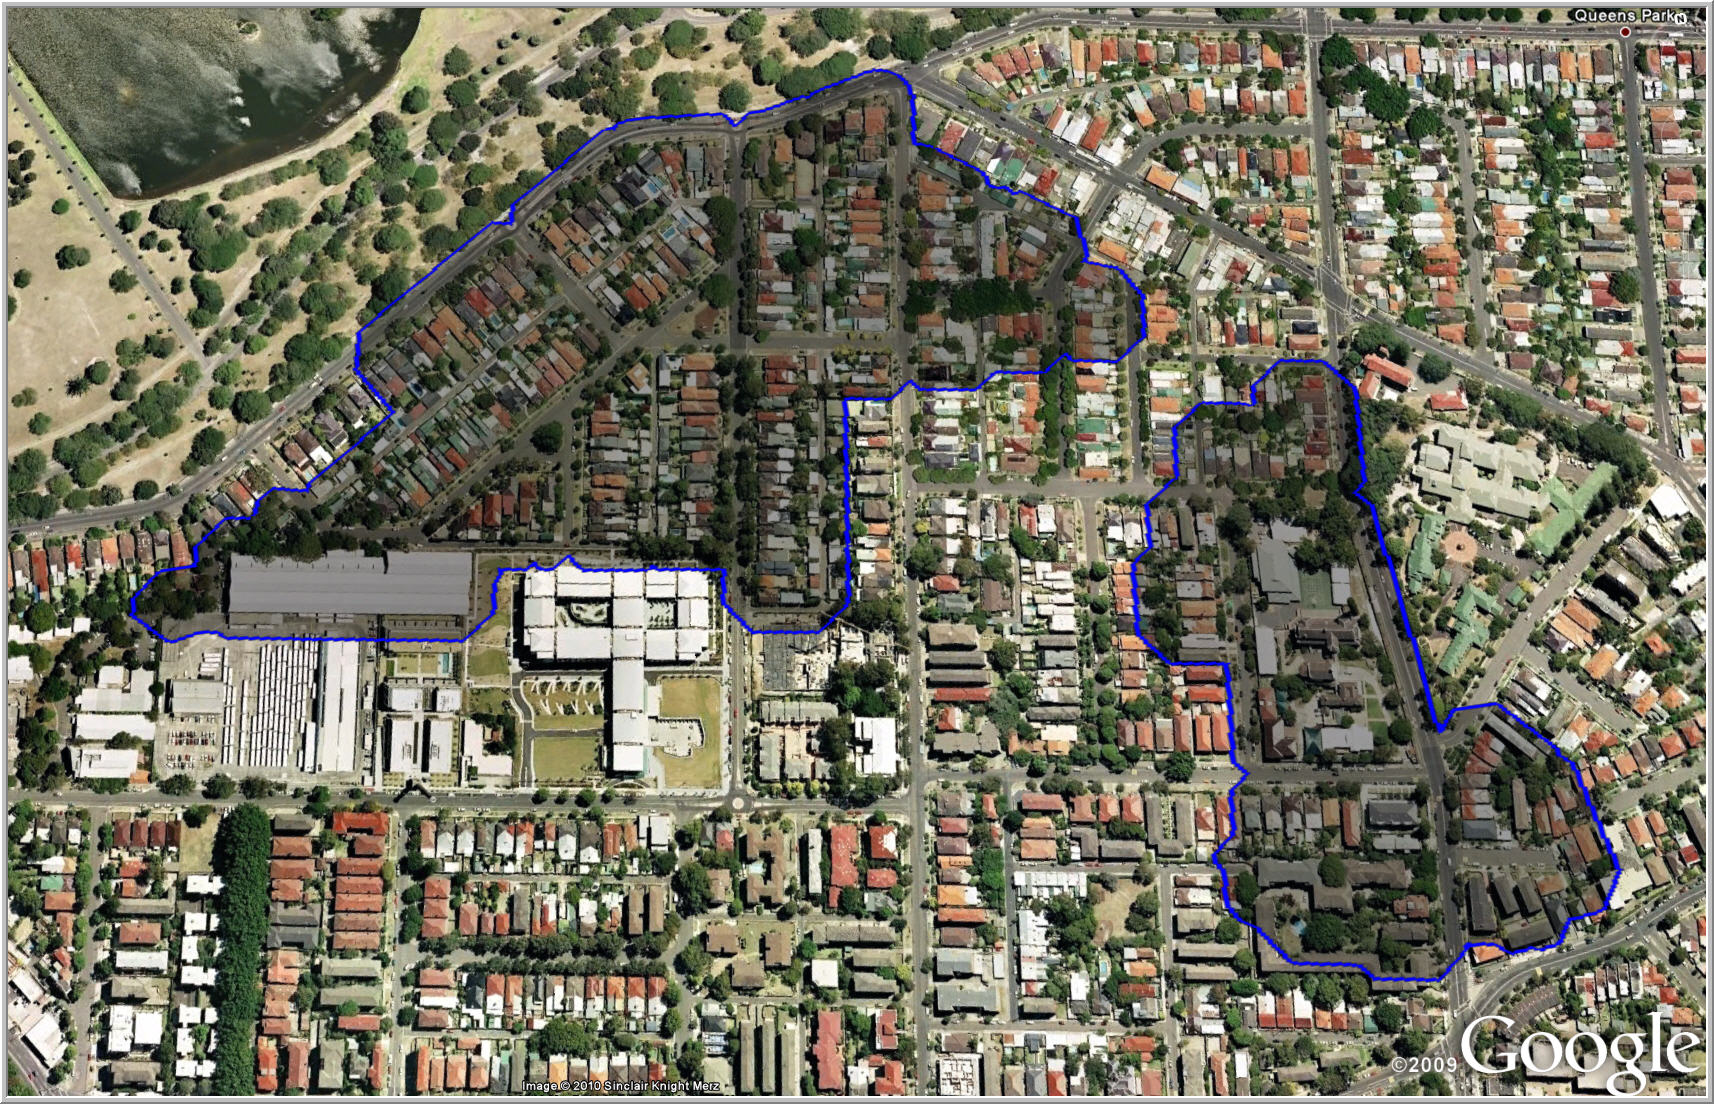
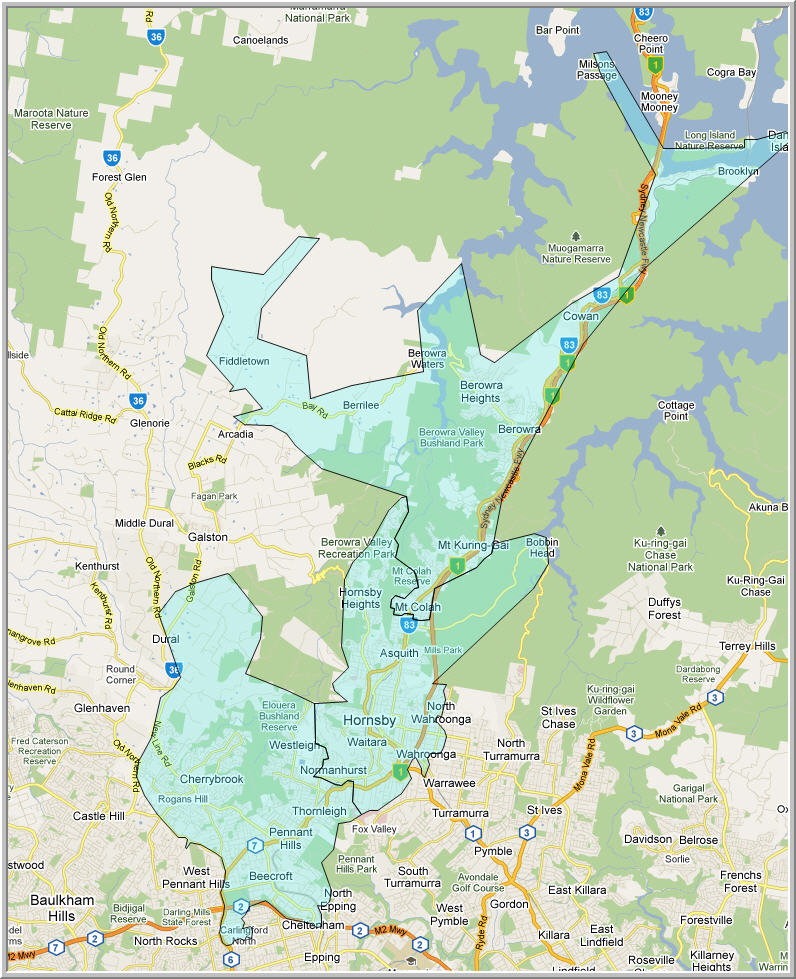
Energy Australia is creating mashups with Google Maps to show outages to the media and to the general public. Courtesy of our friends at Communica, here are two samples of how they are sharing their power outage information. (At home, BC Hydro is doing something very similar with Bing Maps.)
Mashups for Internal Use
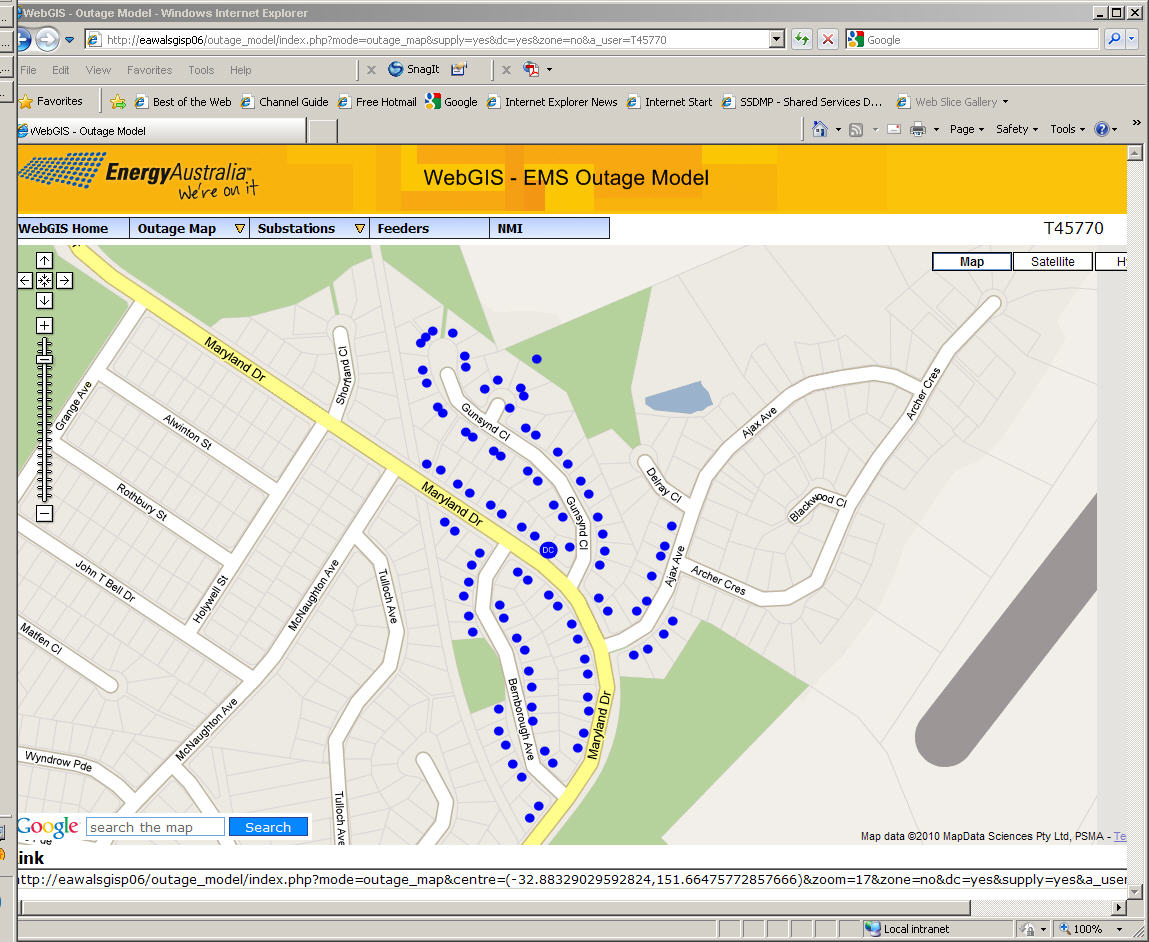
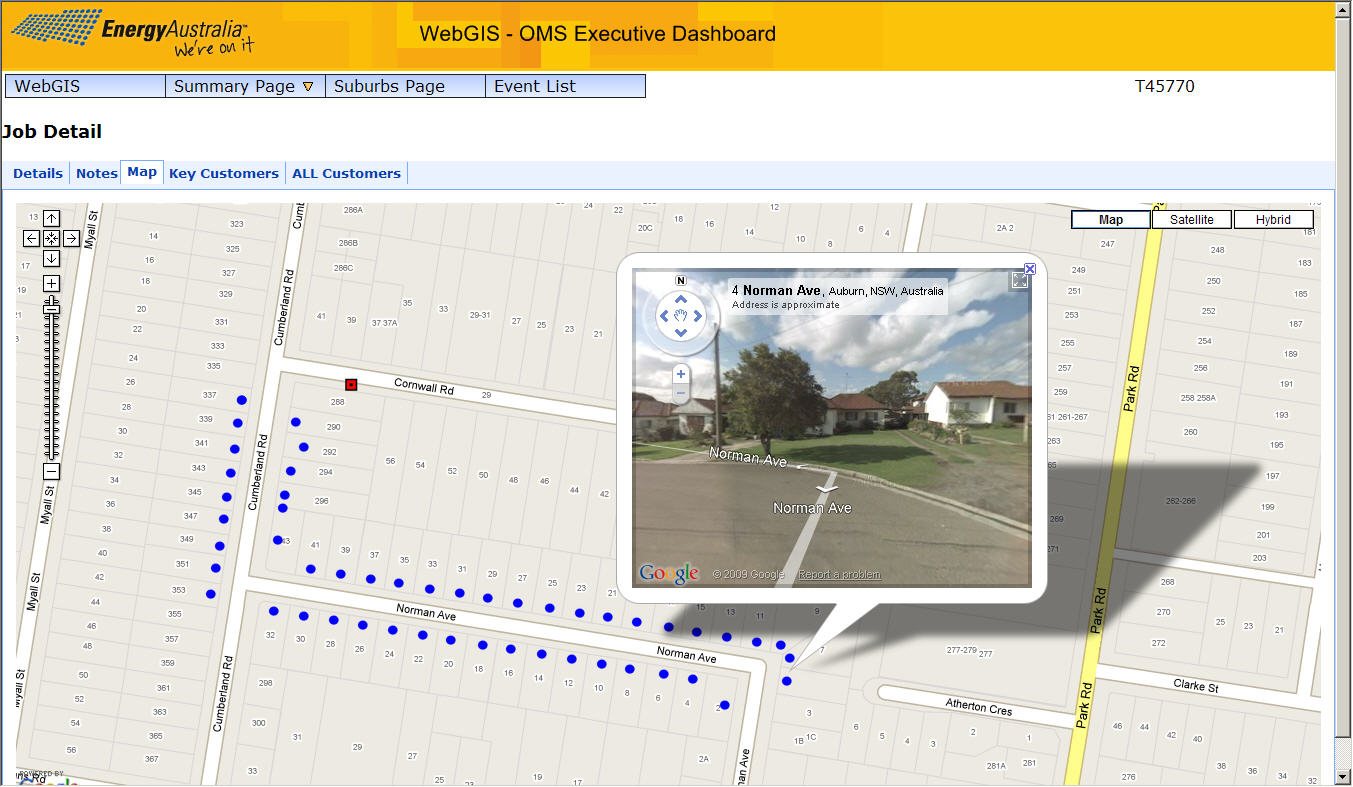
Energy Australia is also creating mashups for internal use to inform employees who are not used to GIS applications. These two samples detail pertinent customer and outage information (credits again to Communica).
So if you’re interested in making your data easier for everyone to use (not just your fellow geonerds), why not consider making a mashup?
[We have some examples on our website using FME Server with Google Maps, Bing Maps, and ArcGIS Server. If you need a bit more power of customization of your maps, you might also want to consider Open Layers.]


