Linear Referencing, FME and Moose Logic

You can’t reason with a moose.
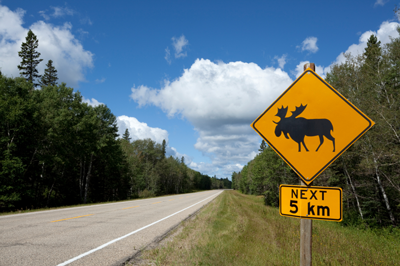
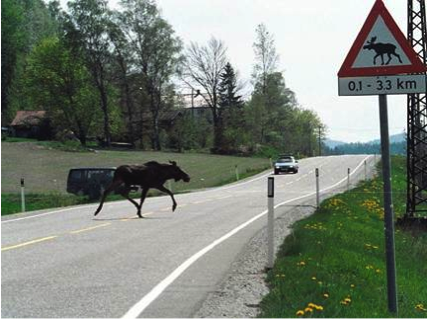
I know this to be true through a lifetime of moose encounters, having met moose in the mountains, moose in the forest, moose in the muskeg, moose in the back yard, and, once, a moose in the bathroom. Really. But by far the most common location for moose meet-ups has been on the highway, shortly after passing a sign like this one.
Now, I do realize that it is only implied and not clearly stated that the moose will, in fact, cross the road….but still. If 700 kg of antlered bull moose simply does not feel like moving out of your way, there really is no talking him out of it. Rational discourse, honking, irrational hollering – none of these have any effect on a moose that has set his mind to ignoring you.
Which brings us, in a rather oblique way, to linear referencing. The sign that gives you the heads-up that there is a stretch of possibly moose-occupied road ahead and so results in you driving half-off the road to go around said moose, rather than running into him in the first place, was likely placed there by a transportation agency that keeps track of such things using a linear referencing system – or “LRS”.
Moose crossing (or not crossing, as the case may be) isn’t just a Canadian phenomenon. Norway is a moose haven too, and Knut Jetlund of the Norwegian Public Roads Administration recently gave a presentation on how he uses FME for linear referencing, analyzing data to look at where the risk of wildlife accidents could be lowered with infrastructure.
The What and Why of LRS
LRS is a popular method of handling data for all sorts of linear things – railways, pipelines, power lines – but it’s probably easiest to understand in the context of roads. Giving directions like “take the second left after milepost 51” or knowing that exit 274 will be two kilometers further down the road since you just passed exit 272 are natural, logical ways of navigating and locating things.
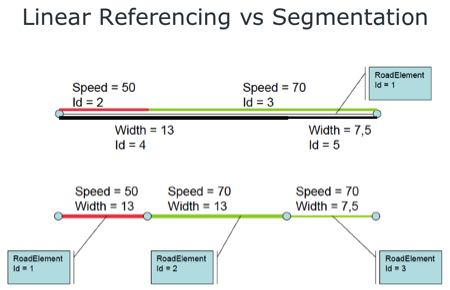
With LRS, things along a linear feature – like a road – are located according to how far down that feature they are. That could be a point, like an exit location, or a length along the feature, such as a guardrail, or speed limit, or road surface type, or… the list goes on and on.
That list is one of the primary reasons to choose LRS in the first place. My own GIS-oriented mind had a little difficulty with the concept at first – why wouldn’t you just assign coordinates to everything and be done with it? But it really does make sense when you consider the multitude of ways that your road geometry would need to be chopped up to reflect the many, many attributes that can change along its length.
Knut deals with somewhere in the vicinity of 400 different feature types along the roadways, all of which can overlap. If the geometry were to be segmented for every unique combination, the road would be an unwieldy mess of points. Alternately, you could store 400 copies of the geometry, each one segmented according to a different attribute. Not very efficient! LRS solves these issues by keeping one version of the geometry, and referencing the rest of the data to it.
But What About the Moose?
 Knut’s example walked us through a scenario where he pulled data from four sources – the road geometry and three tabular datasets that contained the LRS data for accidents, streetlights, and amount of traffic. The goal was to find stretches of road that were prone to accidents, unlit, and therefore candidates for improvement.
The basic workflow was this:
- Convert the accidents from LRS to point geometry.
- Buffer those points by a set radius, and then merge those polygons where they overlap. These merged polygons will show where there are stretches of road prone to accidents.
- Calculate the linear reference for these merged polygons
- Overlay the accident-prone sections and the streetlights, then calculate the geometry
- Apply traffic statistics and find candidates
Today we’ll take a closer look at two parts of this – the conversions from and to LRS.
LRS to Geometry
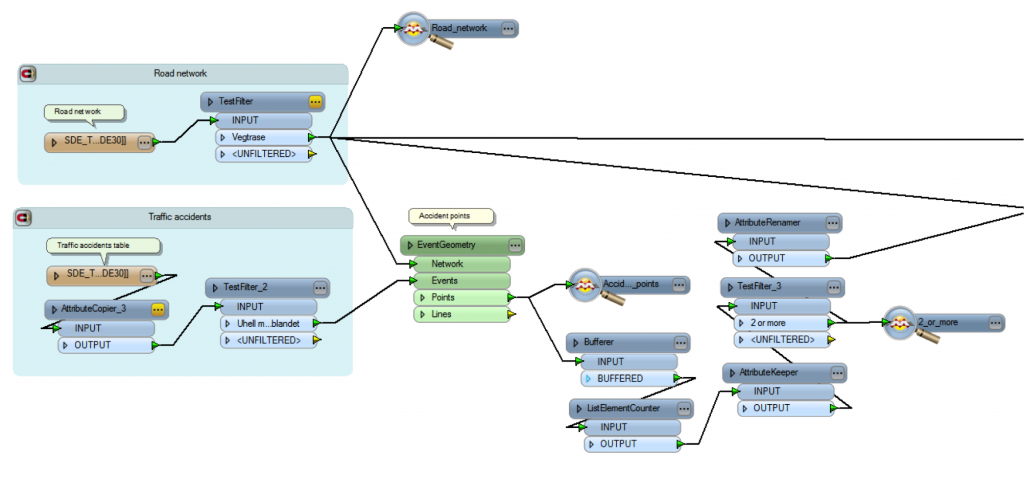
This bit of workspace is taking care of the first part of the workflow. It reads in the road network geometry, and the table containing the LRS accident points. (Click on the image for a closer look.)
After the accident locations are converted to point geometry by positioning them along the road geometry (contained here within a custom transformer), they are buffered. Those resulting polygons are tested for overlaps, and where they do, they are dissolved together. This creates a set of polygons that cover certain stretches of road, which can be clipped and sent on for further processing.

 Geometry to LRS
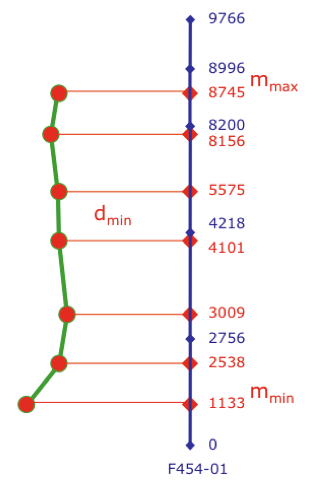
The next task is to convert these snippets of road back into LRS. Knut’s workflow here is to first chop up the lines and extract the individual vertices, and then use a NeighborFinder to find the closest point on the road for each vertex.
One of FME’s LRS-specific transformers, the LengthToPointCalculator, calculates measures for each point, and the data is sorted using lists to determine the minimum and maximum measures.
The Results
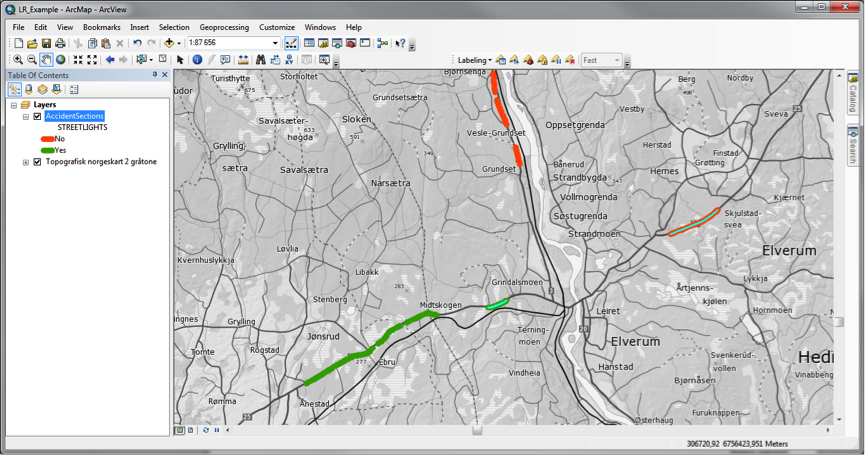
The road segment data, now converted back to LRS, is combined with the traffic statistics and streetlight information as event overlays to highlight areas for potential improvement – shown here.
This is just one example of the multitude of analyses that are possible – with 400 feature types, the combinations are nearly endless. Knut tells us that his vision of the future of road data management at the Norwegian Public Roads Administration includes FME Server handling self-serve user requests for custom-segmented road network geometry. His users need the data chopped up in numerous combinations. Pavement age, speed limit, traffic quantity, road signs – all are attributes they may want geometrically represented, be it for spatial analysis or thematic mapping. Inverse workflows can also be automated, such as the case of point data collected with GPS locations which could potentially be uploaded and converted back to LRS without the intervention of an FME specialist.
“I’ve used other software tools,” says Knut, “but when I discovered FME I knew that this was my solution. It works how I think – and it does so many things well.”
And so, should you happen to find yourself having a one-way conversation with a stationary highway moose that is enthusiastically ignoring you, think of LRS and FME – and the amount of data that goes into placing that crossing sign at the best possible location.
You can learn more about LRS and FME with this previously recorded webinar.
