Good Maps, Bad Maps (and a Volcano)
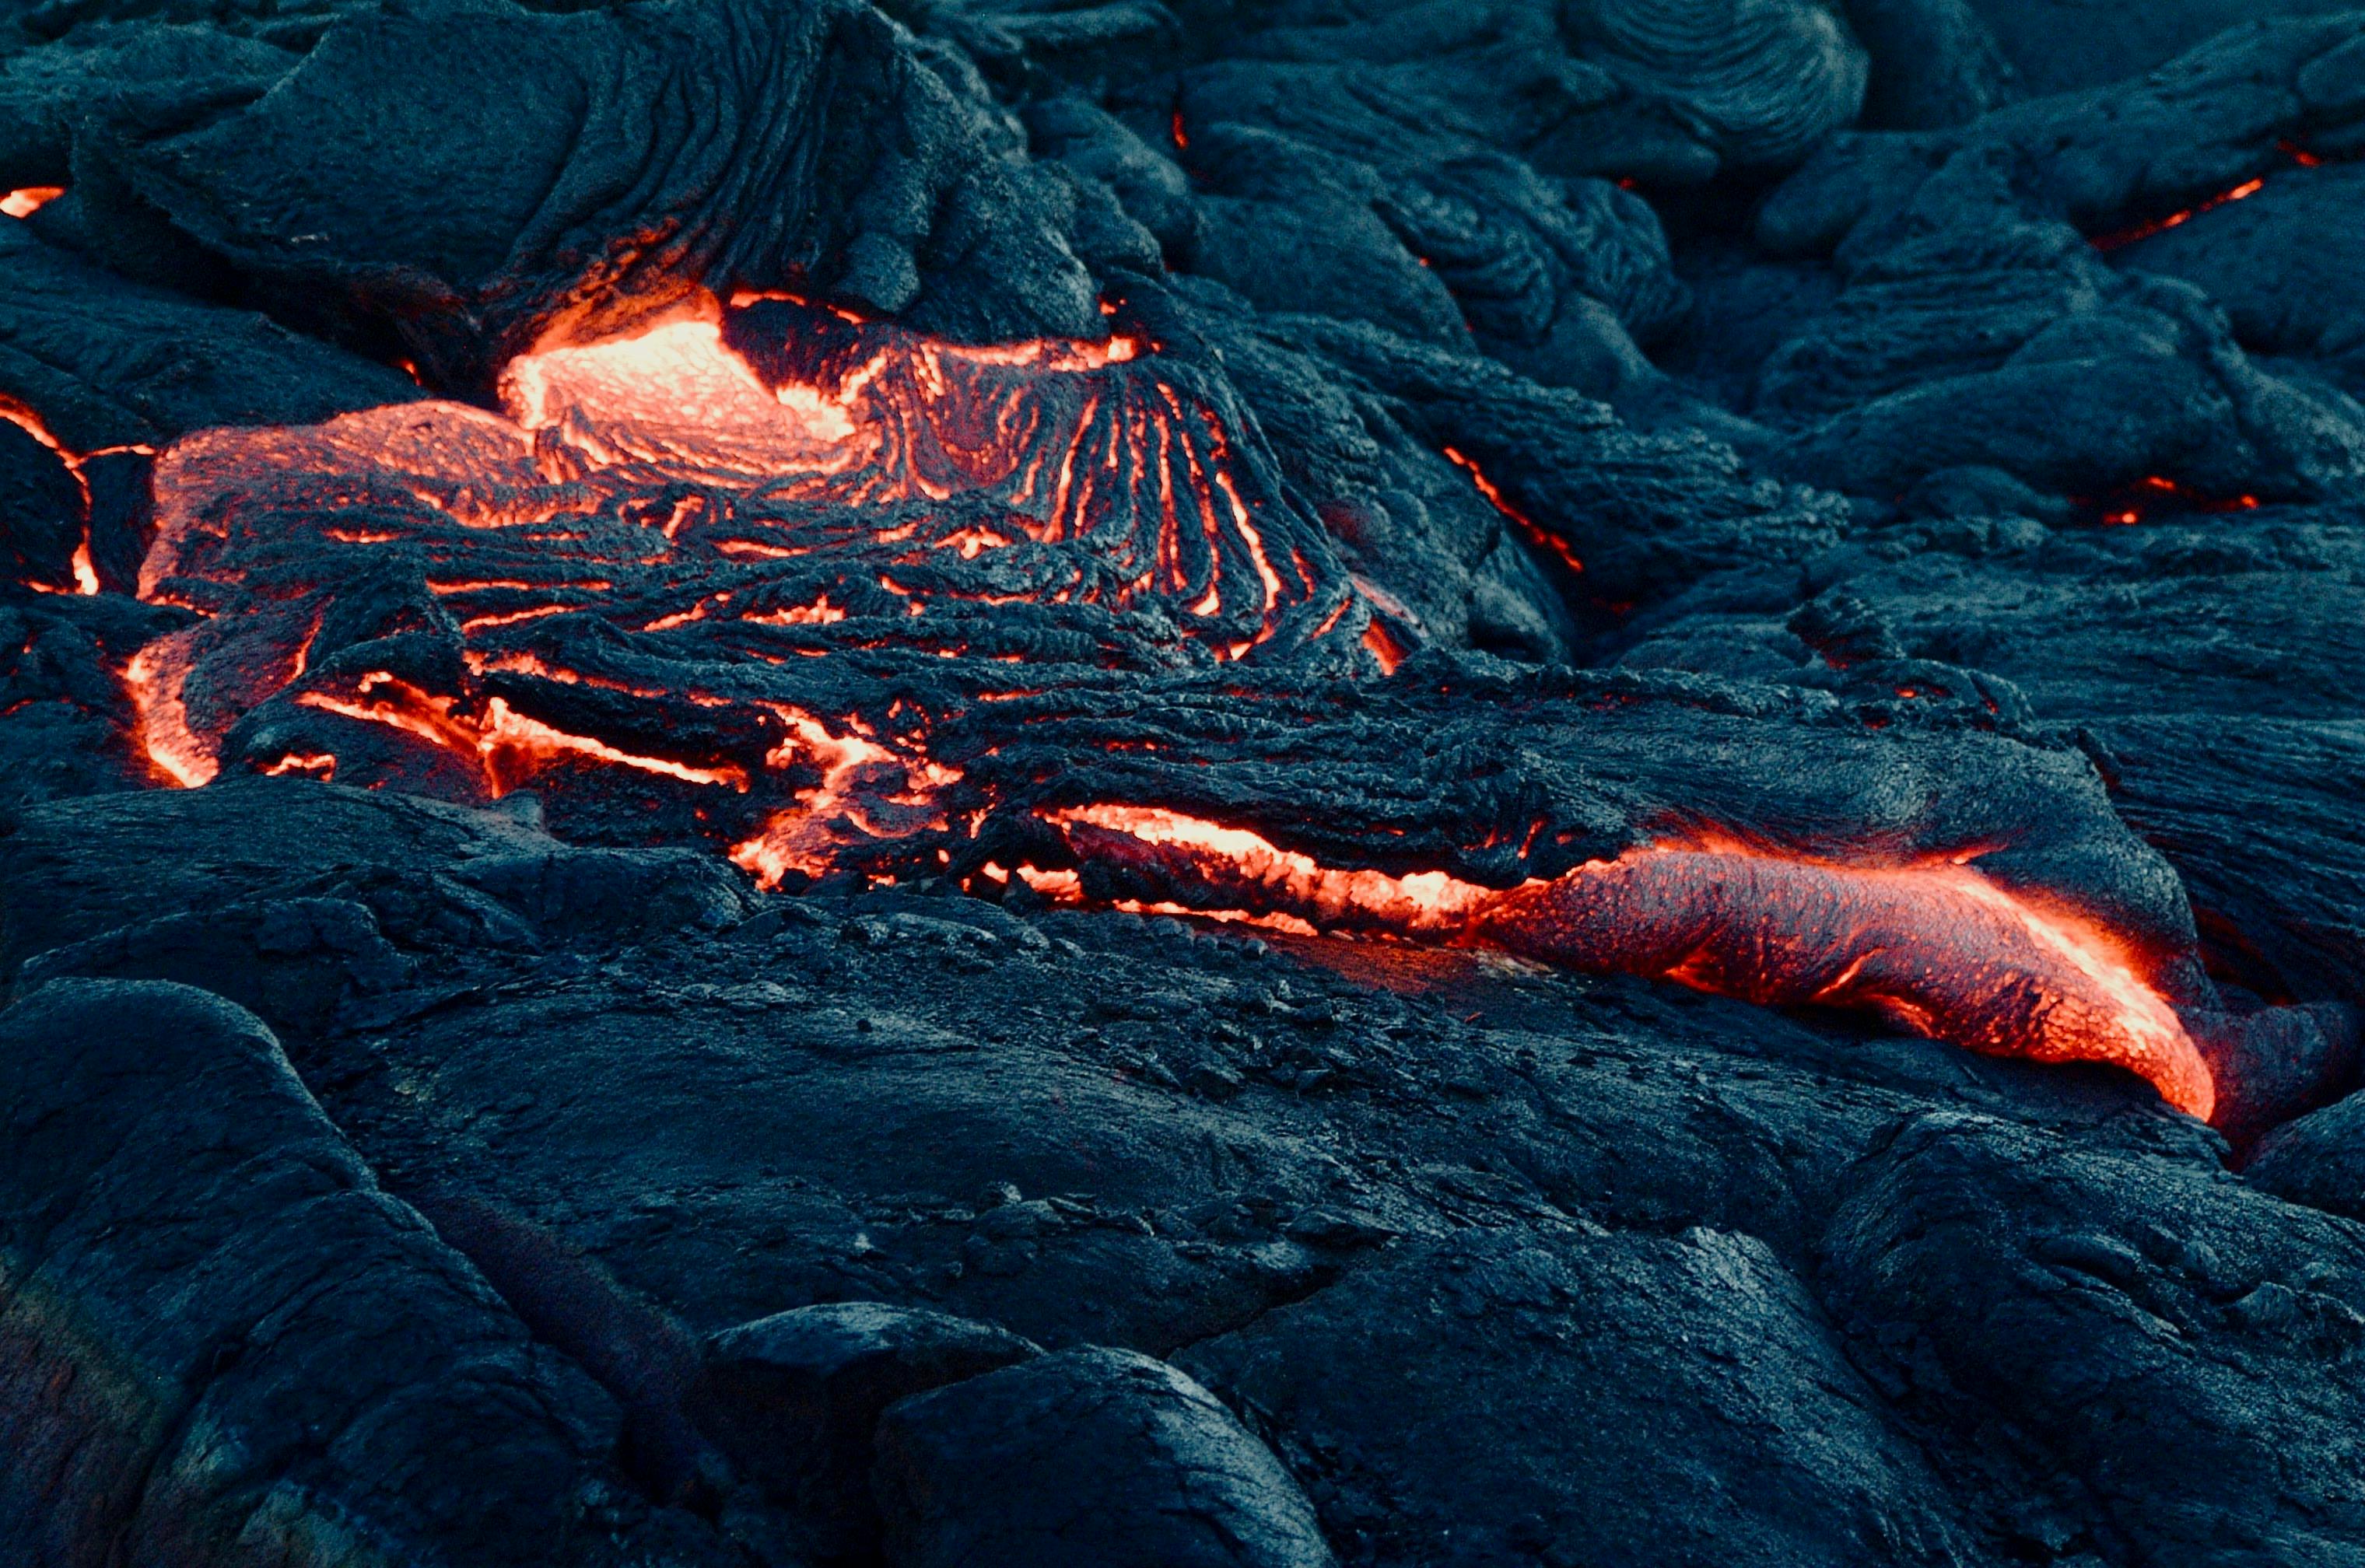
This past week I had a run-in with a Volcano. I wasn’t injured, just stranded in London for several days after a business trip due to a complete closure of British airspace after a volcano with an unpronounceable name erupted in Iceland. Upon my return, I received a very interesting email from my colleague Dean Hintz who had some great insights on the subject of maps and the Eyjafjallajökull volcano. Dean has graciously agreed to let me share these observations with you all – thanks Dean!
“Given the fallout of the Iceland volcano, the week of airspace closures and cancellations and the colossal mess that resulted, its worth looking back to see some lessons that people might hopefully learn, particularly in regards to a classic case of good and bad mapping. To be sure, this includes some hind sight because we haven’t encountered anything quite like this before.”

“Maps are like stats. They can be very deceiving or misleading if you are not careful. You can see in the image above that the orange ‘scope of ash’ covers a winding path around half the northern hemisphere, from eastern Canada to Russia. This is the same output from the forecast model that the closure of the entire European airspace was based on. Now take a look at the new red zone on the same map. This area starts at Iceland and extends about 700km SE over the ocean. This is accepted as the danger zone now as it does not include all areas of ash but only those with potentially damaging levels of ash, plus a significant buffer just to be safe. This new zone is about 5 – 10% of the old area.”
“So the next time you see a map, read some stats etc, don’t forget to ask the question as to where it came from and what exactly it means. New models, maps etc need to be challenged before we let them have such an impact. I think the first ‘scope’ map, combined with scary stories / YouTube videos about all engines failing (a plane flying through a thick visible plume within 100km of the Indonesian volcano) was enough to instil an emotional reaction in the regulators and the public so that they were loathe to question the old safety regulations (zero tolerance for even the possibility of trace ash).”


“Another more detailed example above is from Apr 20” (click the map for full-size). “These maps come straight from the Eurocontrol website from the computer model used to justify the blanket bans. Also notice the revised map showing just the areas of higher ash concentration. Fortunately the airlines didn’t take it all sitting down and started to do their own test flights as a sanity check to see if the trace ash was as dangerous as predicted. Hard to believe that the output of the UK Met office’s computer model was used to close airports 3500 km away from a volcano with virtually no actual testing or verification (except a couple of Met flights in the UK). If verification and testing had begun within 24 hours of the ban, we may have had airspace open 3 days earlier and saved a lot of headaches and money.”
“One of the best way to measure ash on a wider scale without direct sampling is with LIDAR. Unfortunately this time round, there weren’t enough LIDAR scanning platforms and processing ability to properly track the ash.”
Great stuff by Dean. Hopefully next time LIDAR or other technologies will be able to be utilized to ensure that the data used to determine when to close airports is accurate. Safe’s President Don Murray is headed out to London this weekend. Don, if you do get stranded, remember that the Apple Store on Regent Street has great free wi-fi!